Vega backend examples
Note: for this notebook to work, you need to have ``vega3`` library installed.
pip install vega3
[1]:
from physt.examples import normal_h1, normal_h2, normal_h3, munros
from physt.plotting import set_default_backend

import numpy as np
np.random.seed(42)

set_default_backend("vega")
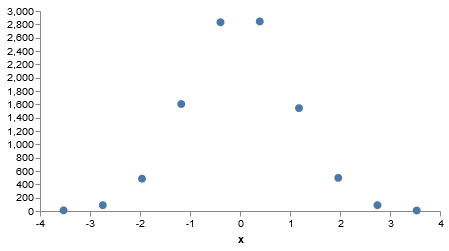
[2]:
H = normal_h1()
H.plot.scatter()
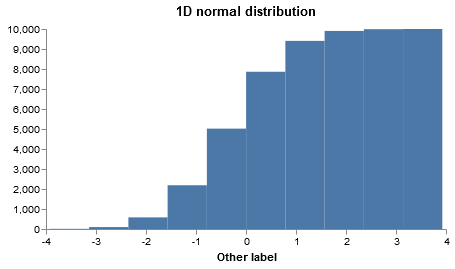
[3]:
H.plot.bar(cumulative=True, xlabel="Other label")
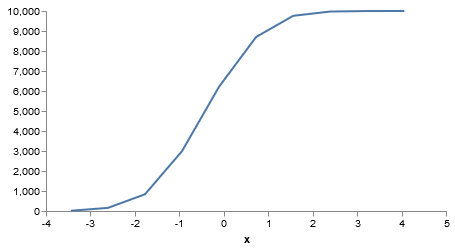
[4]:
H = normal_h1()
H.plot.line(cumulative=True)
[5]:
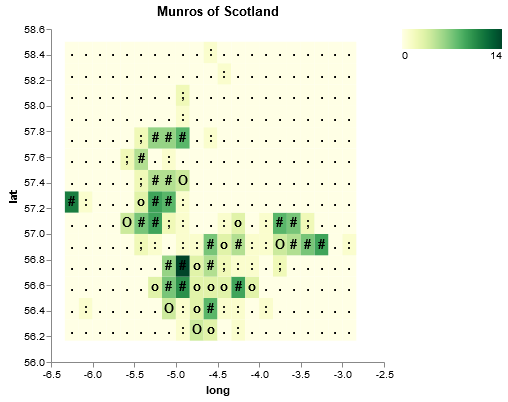
H2 = munros().T
H2.plot(cmap="YellowGreen", show_values=True, height=333, width=333, value_format=".:;oO##############".__getitem__)
Example of an interactive 3D histogram
Note: Unfortunately, this example does not render properly nor in GitHub renderer or notebook viewer. A live notebook must be running.
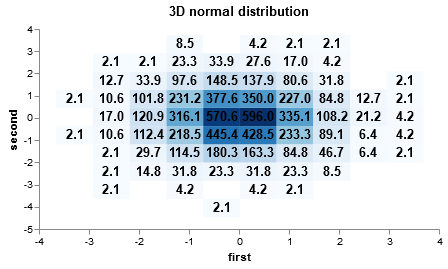
[6]:
H3 = normal_h3()
H3.axis_names = ("first", "second", "third")
H3.plot(show_values=True, show_zero=False, cmap="Blues", density=True, show_colorbar=False, value_format=".1f")