Histogram collections
WARNING: Experimental functionality that will probably be redesigned (in version 0.7 or later).
[1]:
import numpy as np
np.random.seed(42)

from physt import h1
from physt.types import HistogramCollection
[2]:
from physt.plotting import set_default_backend
set_default_backend("matplotlib")
[3]:
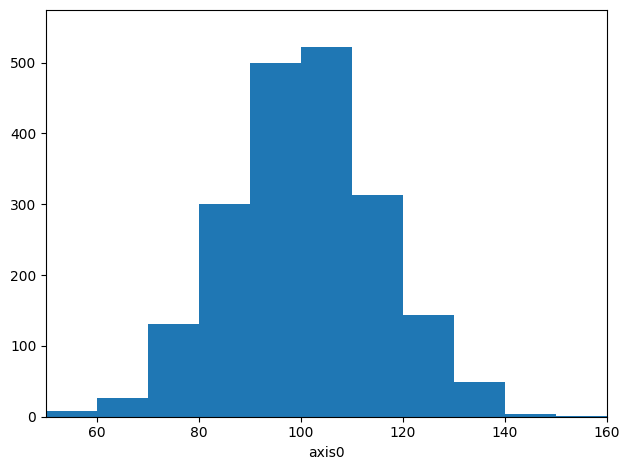
data1 = np.random.normal(100, 15, 2000)
h_a = h1(data1, "fixed_width", bin_width=10, name="first")
h_a.plot();
[4]:
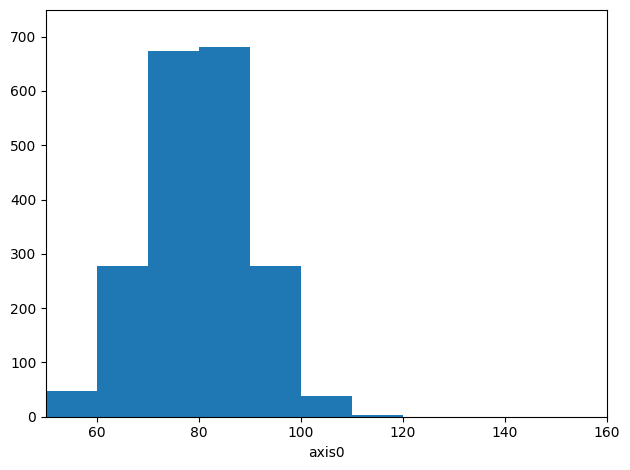
data2 = np.random.normal(80, 10, 2000)
h_b = h1(data2, h_a.binning, name="second")
h_b.plot();
[5]:
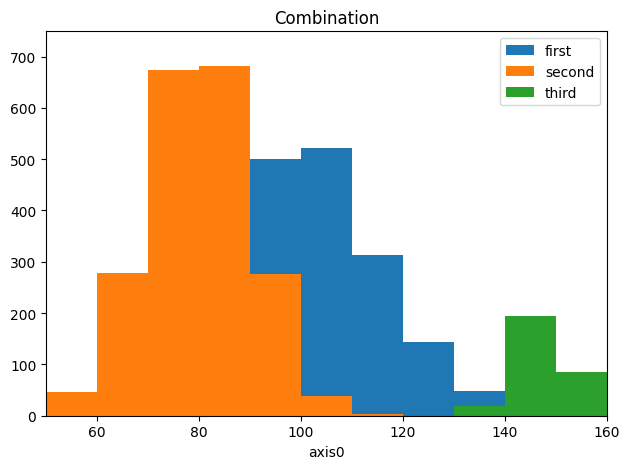
collection = HistogramCollection(h_a, h_b, title="Combination")
[6]:
collection.create("third", np.random.normal(148, 5, 300))
[6]:
Histogram1D('third', bins=(11,), total=299, dtype=int64)
Plotting in matplotlib
[7]:
# The default
collection.plot();
[8]:
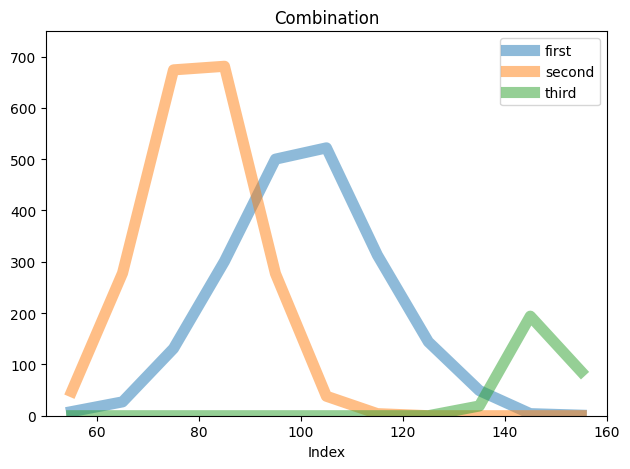
# Add some options
collection.plot.line(alpha=.5, lw=8, xlabel="Index");
Plotting in vega
(Currently broken)
[9]:
# set_default_backend("vega")
[10]:
# collection.plot.scatter(legend=False)
[11]:
#collection.plot.line(lw=7, legend=True, alpha=.5)