Adaptive histogram
This type of histogram automatically adapts bins when new values are added. Note that only fixed-width continuous binning scheme is currently supported.
[15]:
# Necessary import evil
from physt import h1
import numpy as np
import matplotlib.pyplot as plt
[16]:
# Create an empty histogram
h = h1(None, "fixed_width", bin_width=10, name="People height", axis_name="cm", adaptive=True)
h
[16]:
Histogram1D('People height', bins=(0,), total=0, dtype=int64)
Adding single values
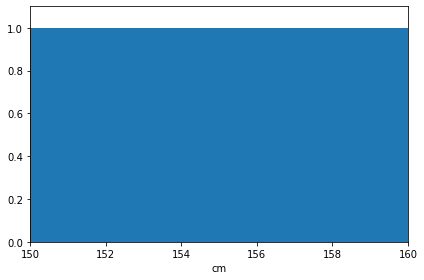
[17]:
# Add a first value
h.fill(157)
h.plot()
h
[17]:
Histogram1D('People height', bins=(1,), total=1, dtype=int64)
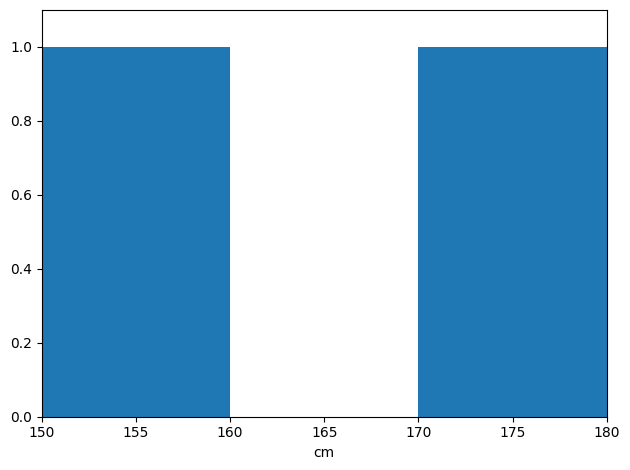
[18]:
# Add a second value
h.fill(173)
h.plot()
[18]:
<Axes: xlabel='cm'>
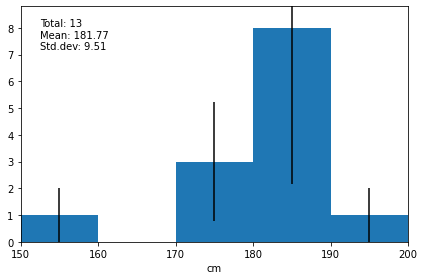
[19]:
# Add a few more values, including weights
h.fill(173, 2)
h.fill(186, 5)
h.fill(188, 3)
h.fill(193, 1)
h.plot(errors=True, show_stats=True);
Adding multiple values at once
[20]:
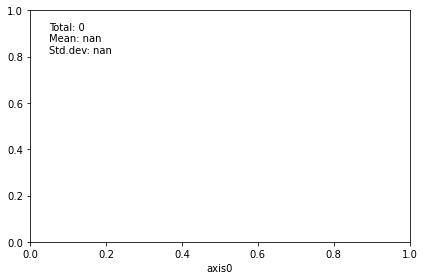
ha = h1(None, "fixed_width", bin_width=10, adaptive=True)
ha.plot(show_stats=True);
[21]:
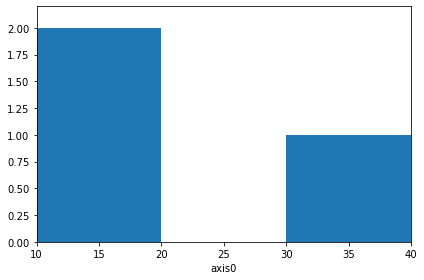
# Beginning
ha.fill_n([10, 11, 34])
ha.plot();
[22]:
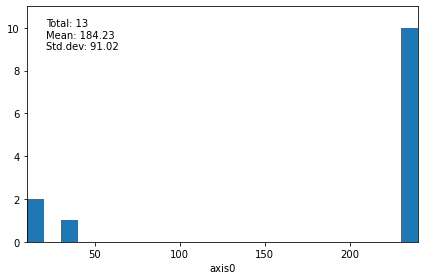
# Add a distant value
ha.fill_n([234], weights=[10])
ha.plot(show_stats=True);
[23]:
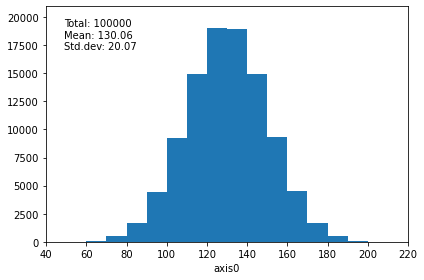
# Let's create a huge dataset
values = np.random.normal(130, 20, 100000)
[24]:
%%time
# Add lots of values (no loop in Python)
hn = h1(None, "fixed_width", bin_width=10, adaptive=True)
hn.fill_n(values)
# ha.plot()
CPU times: total: 15.6 ms
Wall time: 15.2 ms
[25]:
%%time
# Comparison with Python loop
hp = h1(None, "fixed_width", bin_width=10, adaptive=True)
for value in values:
    hp.fill(value)
CPU times: total: 3.91 s
Wall time: 4.01 s
[26]:
# Hopefully equal results
print("Equal?", hp == hn)
hp.plot(show_stats=True);
Equal? True
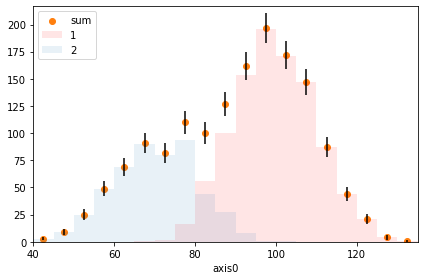
Adding two adaptive histograms together
[27]:
ha1 = h1(None, "fixed_width", bin_width=5, adaptive=True)
ha1.fill_n(np.random.normal(100, 10, 1000))

ha2 = h1(None, "fixed_width", bin_width=5, adaptive=True)
ha2.fill_n(np.random.normal(70, 10, 500))

ha = ha1 + ha2

fig, ax= plt.subplots()

ha1.plot(alpha=0.1, ax=ax, label="1", color="red")
ha2.plot(alpha=0.1, ax=ax, label="2")

ha.plot("scatter", label="sum", ax=ax, errors=True)

ax.legend(loc=2);   # TODO? Why don't we show the sum???