Merging bins
[1]:
from physt.binnings import *
from physt import h1, h2
import numpy as np

np.random.seed(42)

%matplotlib inline
[2]:
data = np.random.rand(100)
[3]:
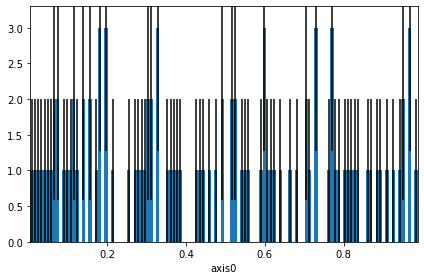
hh = h1(data, 120)
hh.plot(errors=True);
[4]:
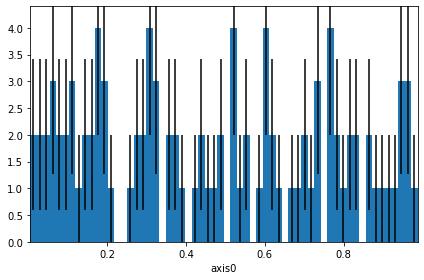
hh.merge_bins(2, inplace=True)
hh.plot(errors=True);
[5]:
hh.merge_bins(2, inplace=True)
hh.plot(errors=True);
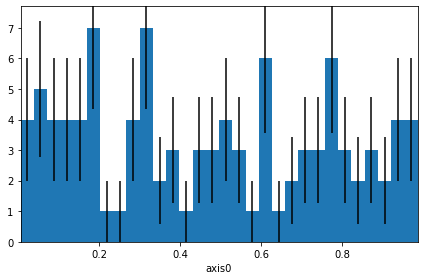
[6]:
hh.merge_bins(2, inplace=True)
hh.plot(errors=True);
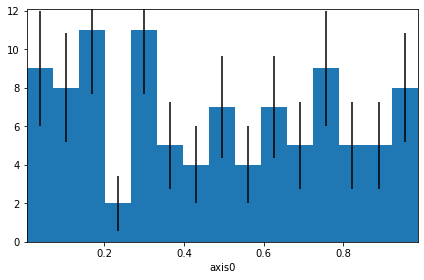
[7]:
hh.merge_bins(2, inplace=True)
hh.plot(errors=True);
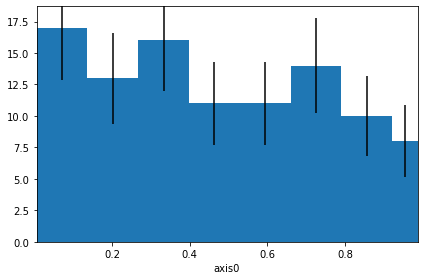
[8]:
hh.merge_bins(2, inplace=True)
hh.plot(errors=True);
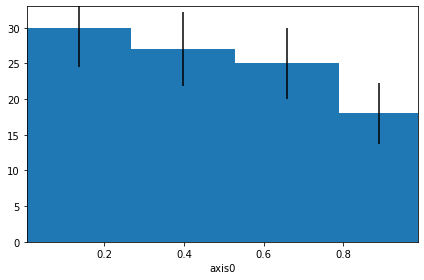
[9]:
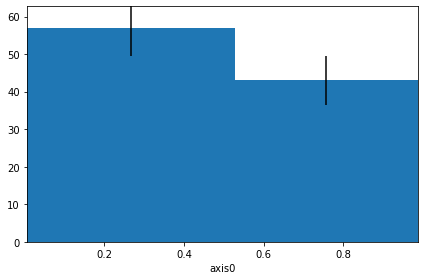
hh.merge_bins(2, inplace=True)
hh.plot(errors=True);
By min frequency
[10]:
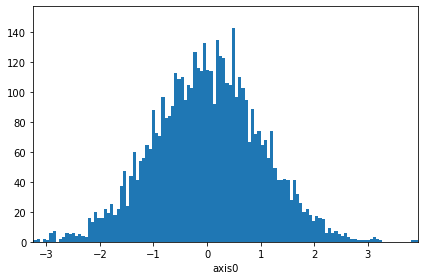
data = np.random.normal(0, 1, 5000)
hh = h1(data, 120)
hh.plot();
[11]:
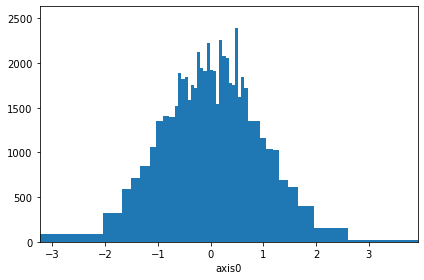
hh.merge_bins(min_frequency=100, inplace=True)
hh.plot(density=True);
[12]:
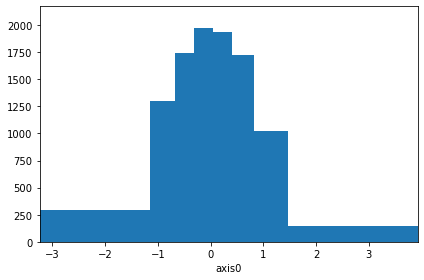
hh.merge_bins(min_frequency=600, inplace=True)
hh.plot(density=True);
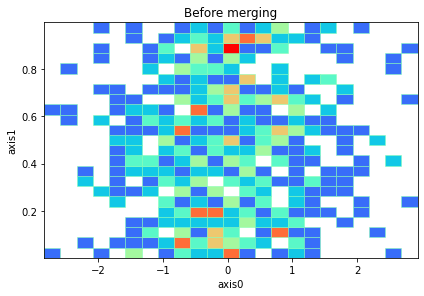
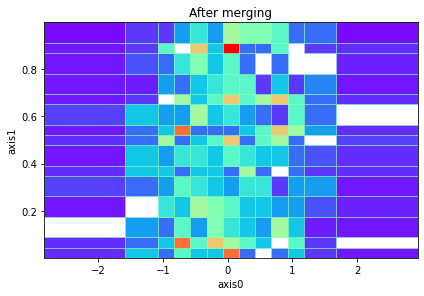
The same can be done for 2D histograms (i.e. each column, each row should contain more than the minimum). Unfortunately, a general, irregular-shaped binning is not yet supported.
[13]:
# 2D example
data1 = np.random.normal(0, 1, 600)
data2 = np.random.rand(600)
[14]:
hh = h2(data1, data2, 23)
ax = hh.plot(show_zero=0, cmap="rainbow", show_colorbar=False);
ax.set_title("Before merging")
hh.merge_bins(min_frequency=30, inplace=True)
ax = hh.plot(density=True, show_zero=False, cmap="rainbow", show_colorbar=False)
ax.set_title("After merging");
